
Read a map, then read its numbers
These guides explain how projections change the drawing of a place, how area figures depend on their source, and what original calculations from our map dataset reveal.
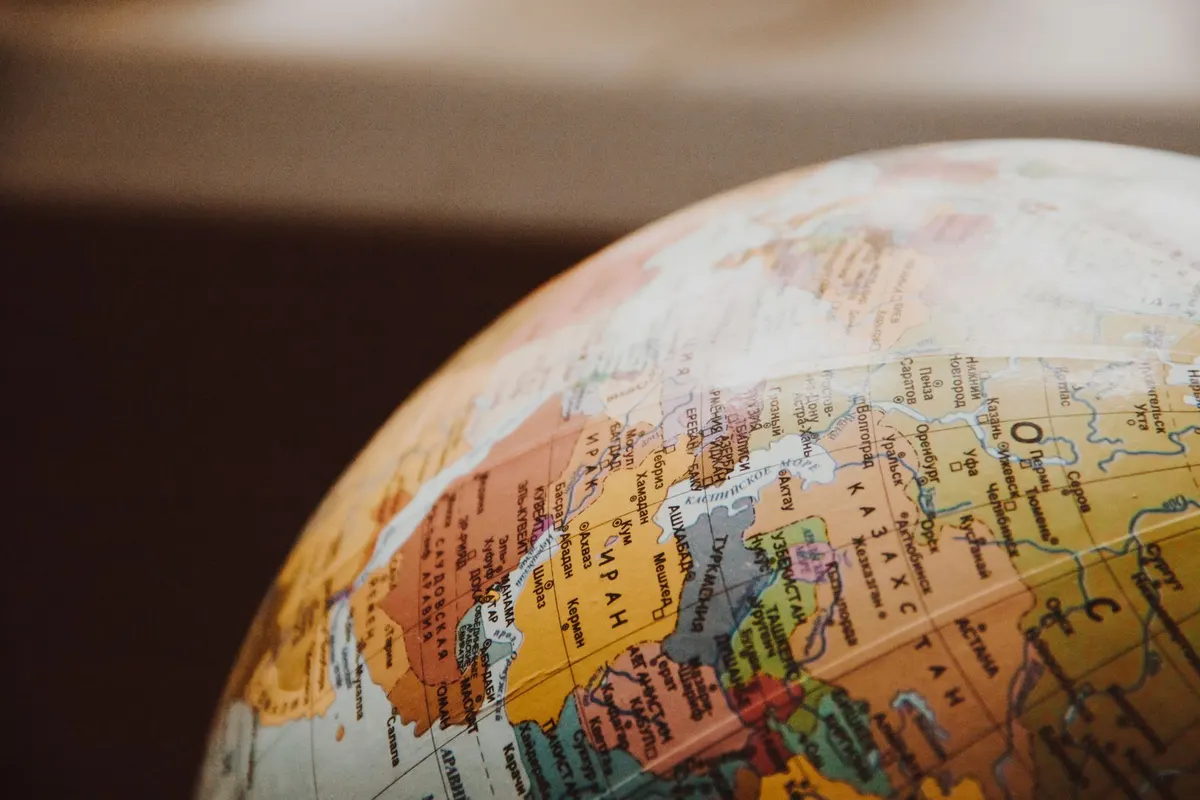
Why does a country change size on a map?
Move the same small patch from the equator toward the pole in an interactive diagram. Compare Mercator, the wide world view and Equal Earth.
What does a country’s area include?
Compare land area, total surface area and the boundary-derived estimates used here. A worked Brazil example shows why a number needs its source.
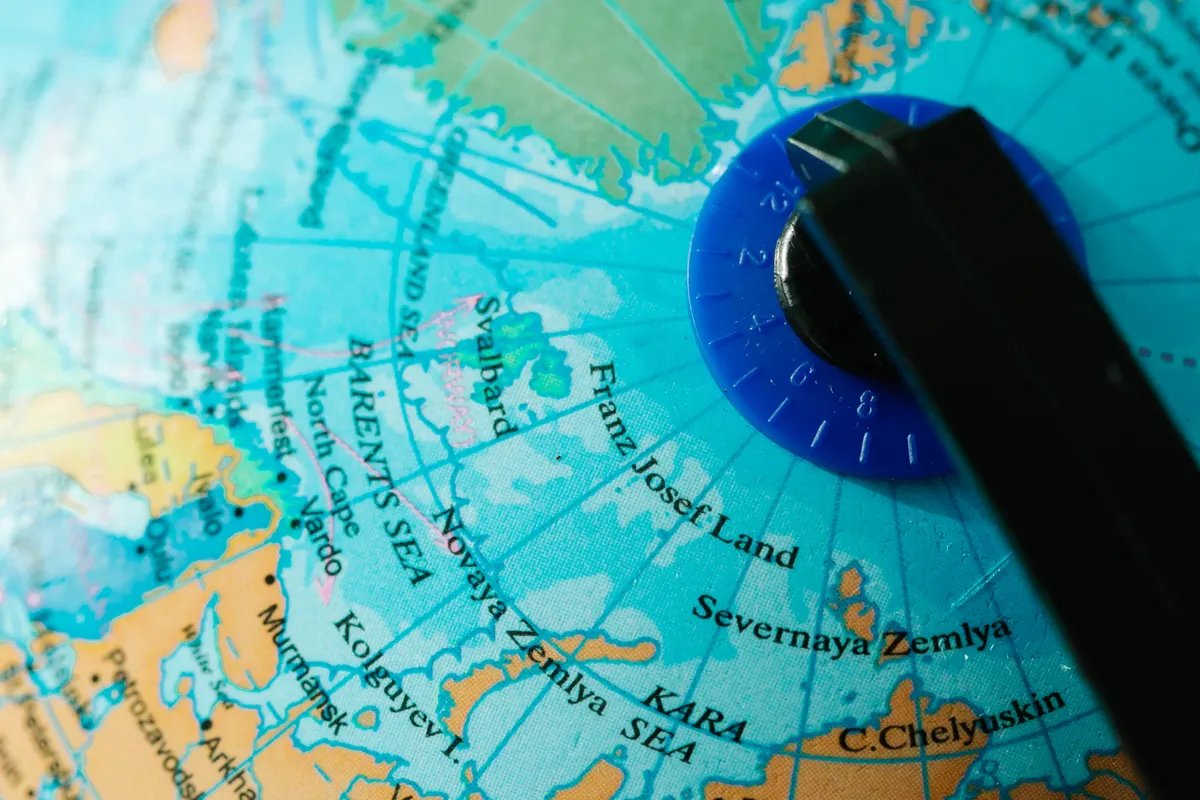
How much does Mercator enlarge area?
See calculated area scale by latitude, plus local factors at seven places in our map data. Learn why a point factor cannot describe an entire country.
Which places are largest in this map?
Read a reproducible top-20 ranking from the mapped polygons, with close-rank notes and the distinction between a territory and a sovereign state.
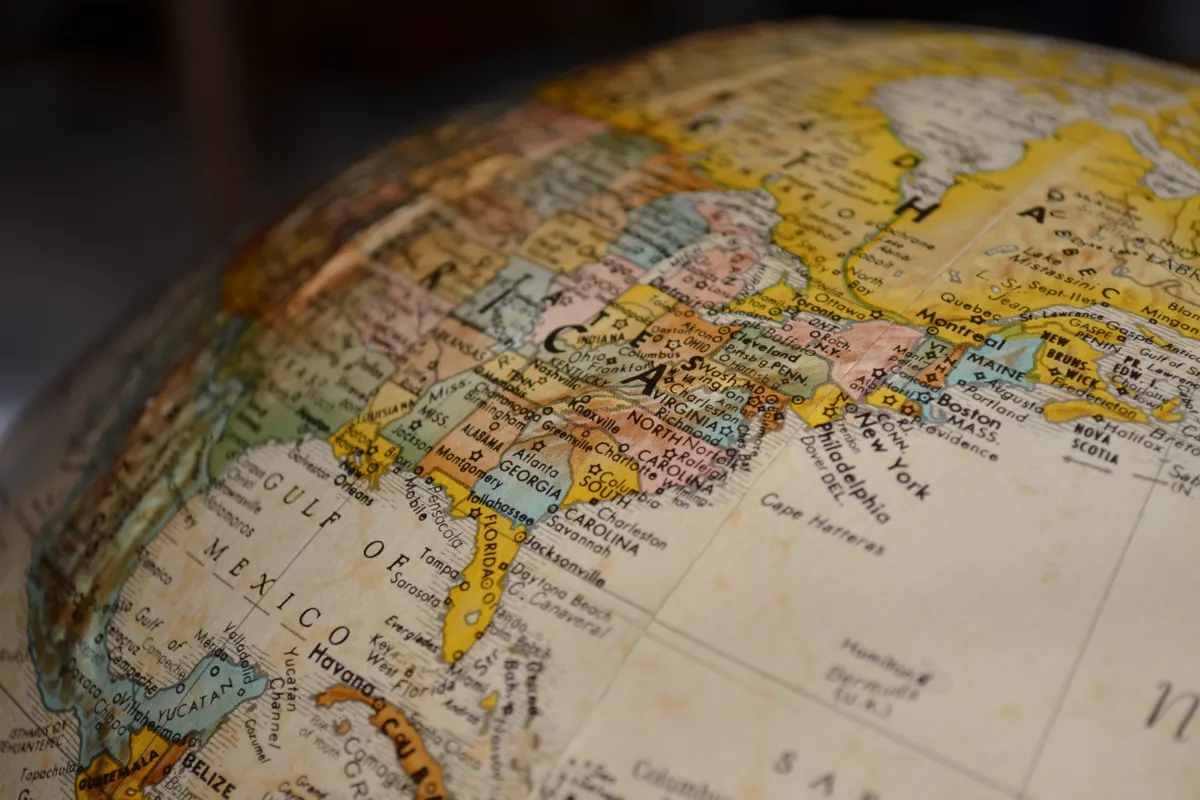
Which countries are nearly the same size?
Explore ten near ties found among 5,671 country and territory pairings, and learn when a tiny numerical difference is too fragile to treat as a survey result.
Start with the question
If a country looks unexpectedly large on a familiar world map, begin with the projection guide. It shows how the same small patch is drawn at several latitudes. Mercator magnifies area toward the poles, while Equal Earth keeps one area scale across the map. Neither drawing changes the area of the place itself.
If two sources give different sizes for one country, begin with the area guide. A land-area figure, a total-area figure and an estimate from a map polygon answer different questions. The Brazil example compares those definitions without treating one figure as a correction to another.
Choose a reliable comparison
Use the area index when you need the approximate size of a mapped place from this site’s boundary data. Open a comparison article when you need both the numerical ratio and an explanation of what the map may hide. For example, Greenland looks prominent on Mercator, yet India has more measured area in this dataset. Mexico and Indonesia are much closer, so the boundary source matters more to the answer.
All figures on this site use the original Natural Earth 1:50m country polygons before their outlines are simplified for display. They are internally consistent estimates, not official land or total-area statistics. For a report, name the dataset and the kind of area you used; for a lesson, the printable classroom activity asks learners to make that distinction after they test a visual prediction.